ブックタイトル明星大学 心理学年報 第32号
- ページ
- 12/74
このページは 明星大学 心理学年報 第32号 の電子ブックに掲載されている12ページの概要です。
秒後に電子ブックの対象ページへ移動します。
「ブックを開く」ボタンをクリックすると今すぐブックを開きます。
このページは 明星大学 心理学年報 第32号 の電子ブックに掲載されている12ページの概要です。
秒後に電子ブックの対象ページへ移動します。
「ブックを開く」ボタンをクリックすると今すぐブックを開きます。
明星大学 心理学年報 第32号
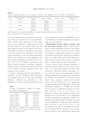
8明星大学心理学年報2014年第32号Table 3Average Response Latencies (ms),Number of Errors, and Attitude Scores for SECT in Experiment 1Block123456Original valence oftargetPositivePositiveNegativeNeutralPositiveNegativeNegativePositiveNegativeConverted valenceoftargetResponse latency Number of errors679(105)740(106)703(112)706(107)780(118)697 (86)2.31(2.06)2.54(2.22)3.46(2.54)3.15(2.48)3.08(2.43)1.77(2.17)Note.Attitude score represents the difference in average response latencies between two blocks.Digits in parentheses are standard deviations.Attitude score fortarget613-83themean responselatencyand number oferrors foreach of the six main blocks. For each participant,three attitude scores pertaining to three targetpictures were obtained by subtracting the meanresponse latency for the positive block from themean response latencyfor the negative block,as inthe FUMIE test (Table 3). Magnitude relationshipsof the three attitude scores obtained were matchedwith the prediction.A one-waywithin-participantsANOVA with attitude score as the dependent variablerevealeda significant main effect (F(2,24)=10.64, p<.001,η?=.18). Multiple comparisons usingRyan’s method revealed a significant differencebetween thethreeattitudescores with theexceptionof the comparison between originally positive andoriginally neutral targets.In order to investigate the split-half reliabilityofthe SECT, 32 trials included in each main blockwere divided evenlyinto two parts and an adjustedreliability coefficient was calculated as in theFUMIE test,which revealed that theSECT showedTable 4Average of Participants’Ratings for Targetsand Fillers in Experiment 1Type Slide No. RatingsPositive Target14608.54(0.88)Neutral Target70004.69(1.25)Negative Target93001.23(0.60)Positive Filler 150007.54(1.13)Positive Filler 256216.69(1.03)Negative Filler 194712.69(2.50)Negative Filler 296002.92(2.06)Note. Digits in parentheses are standard deviations.Slide No. refers to ID numbers of pictures in Lang,Bradley, & Cuthbert (2005).lower reliability(ρ=.64) than the FUMIE test, butwas sufficient as an indirect attitudescoremeasureusing response latencies.Relationships between indirect measures andthe self-report measure. Table 4 shows participants’averagepleasantness ratings for threetargetpictures and four filler pictures.As shown in Table4, participants’pleasantness ratings were almostcomparable with the mean valence scores found byLang et al. (2005). These scores imply that participantsrated two positive filler pictures as pleasantand two negative filler pictures as unpleasant.Figure 2 shows scatter diagrams depicting indirectself-report measures from thepresent experiment.Two simple linear regression analyses wereconducted to determine whether participants’ratingson theself-report measure(dependent variable)could bepredicted using attitudescores obtained bythe FUMIE test and the SECT. The results of thesimple linear regression analysis with attitudescores from the FUMIE test as the independentvariable revealed that the dependent variable wassignificantly predicted by FUMIE test attitudescores;however, an adjusted R squared was small(F(1, 37)=5.70, p<.05,η?=.13; R ??? ?=.11).Results of a simple linear regression analysis withattitude scores from the SECT as the independentvariable revealed that the dependent variable wassignificantlypredicted bySECT attitudescores andthat theindependent variablewas a better predictor(F(1, 37)=23.14, p<.001,η?=.38; R ??? ?=.37).The present study did not investigate the correlationcoefficients between attitude score and pleasantnessrating for each target picture, because the