ブックタイトル明星大学 心理学年報 第32号
- ページ
- 17/74
このページは 明星大学 心理学年報 第32号 の電子ブックに掲載されている17ページの概要です。
秒後に電子ブックの対象ページへ移動します。
「ブックを開く」ボタンをクリックすると今すぐブックを開きます。
このページは 明星大学 心理学年報 第32号 の電子ブックに掲載されている17ページの概要です。
秒後に電子ブックの対象ページへ移動します。
「ブックを開く」ボタンをクリックすると今すぐブックを開きます。
明星大学 心理学年報 第32号
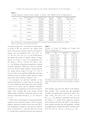
Hayashi:Development and Testing of a New Indirect Attitude Measure for Pictorial Objects13Table 7Average Response Latencies (ms), Number of Errors, and Attitude Scores in Experiment 3GroupC(n=20)D(n=19)Block123456123456Original valenceoftargetConverted valenceof targetPositivePositiveNegativeNeutralPositiveNegativeNegativePositiveNegativePositivePositiveNegativeNeutralPositiveNegativeNegativePositiveNegativeResponselatency681 (99)807(130)780(121)722(147)781(133)701(173)637(114)732(159)629(117)682(140)685(109)658(118)Number oferrors2.40(1.93)3.35(2.64)2.75(2.12)3.10(2.53)4.00(3.31)2.40(2.89)3.11(2.23)4.21(2.39)3.84(2.59)3.53(2.12)5.63(3.13)3.11(1.79)Note.Attitude score (ms)represents the difference in average response latencies between two blocks.Digits in parentheses are standard deviations.Attitude score fortarget (ms)126-58-809553-27on neutral targets (M=-58)relative to participantsin Group D (M=53). However, the simple maineffect ofthegroup variableon positiveandnegativetargets was not significant (F(1, 111)=0.97, n.s,η?=.06;F(1, 111)=2.74, n.s,η?=.02). Furthermore,the simple main effect of original valence of targetpicture on Groups C and D was significant (F(2,74)=29.74, p<.001,η?=.39;F(2, 74)=8.96, p<.001,η?=.24).Multiplecomparisons using Ryan’s methodrevealed significant differences between attitudescores for positive target-negative target and positivetarget-neutral target in Group C (p<.05). InGroup D,thereweresignificant differences betweenattitude scores for positive target-negative targetand neutral target-negative target (p<.05).To investigate the split-half reliability of thepresent experiment,for each of the two groups,the32 trials included in each main block were dividedevenly in two parts, and an adjusted reliabilitycoefficient was calculated as in theprevious experiments.This revealed that both groups showedslightlyhigher reliabilitycoefficients relativeto theprevious experiments (Group C,ρ=.70; Group D,ρ=.75).Table 8 shows participants’averagepleasantnessratings for theexperiment.Figure4shows a scatterdiagram depicting attitude scores from the SECTand pleasantness ratings for each group of participantsin Experiment 3. Using the data from GroupC,a simplelinearregressionanalysiswasconductedTable 8Average of Group A’s Ratings for Targets andFillers in Experiment 3Group Type Slide No. RatingsPositive Target57608.00(1.49)Neutral Target70564.75(0.64)Negative Target95701.25(0.55)CPositive Filler 159827.90(1.37)Positive Filler 223608.35(0.88)Negative Filler 199012.00(1.26)Negative Filler 294401.70(1.03)Positive Target25407.26(1.10)Neutral Target61504.84(0.90)Negative Target12052.26(1.97)DPositive Filler 159827.68(1.38)Positive Filler 223608.53(0.70)Negative Filler 199012.32(1.34)Negative Filler 294402.32(1.42)Note. Digits in parentheses arestandard deviations.SlideNo.refers to ID numbers ofpictures in Lang,Bradley,& Cuthbert(2005).with attitude scores from the SECT as the independentvariable. This revealed that the dependentvariable was significantly predicted by SECT attitudescores (F(1,58)=32.54, p<.001,η?=.36;R ??? ?=.35).Similarly,using data from Group D,the results of a simple linear regression analysiswith attitude scores from the SECT as the independentvariable revealed that the dependent variablewas significantlypredicted bySECT attitudescores(F(1,55)=20.72,p<.001,η?=.27;R ??? ?=.26).